
When testing offers—whether products, concepts, or experiences—we typically collect a global appreciation indicator, for instance by asking for a rating out of 10 or using a scale ranging from “I really like it” to “I don’t like it at all.”
This key indicator serves as a KPI (Key Performance Indicator) and often guides decision-making according to predefined standards: for example, one might decide to launch a new formula if it achieves a significantly higher overall rating than the current formula, with an error risk capped at 5%.
Beyond simply measuring this overall rating, the real challenge is understanding which aspects to address to improve that score.
In other words, it’s about identifying the offer’s drivers of appreciation—the characteristics on which to act to optimize overall satisfaction.
Principles and limitations of traditional “drivers of liking” approaches
The most common approach, in addition to asking for an overall score, is to include a series of closed-ended questions covering various dimensions of the product:
Five-point agreement scale
Example:
“Would you say you strongly agree, somewhat agree, neither agree nor disagree, somewhat disagree, or strongly disagree?”
Examples of statements might be:
- “This product has a nice color.”
- “This product tastes good.”
- “This product is refreshing.”
Five-point critical scale
Example:
“This product is: way too sweet / slightly too sweet / just right / not quite sweet enough / not sweet enough at all.”
When analyzing the data, the objective is to correlate responses to these various criteria with the overall rating, determining to what extent they “explain” the overall appreciation.
Different statistical methods can be used, ranging from simple correlations (linear correlation between each dimension and the overall score) to more complex modeling (Bayesian networks, PLS regressions, etc.).
Despite their benefits, these approaches have several limitations:
Restrictive assumption about the dimensions measured
Closed-ended, predefined questions presuppose that we already know which dimensions matter to the respondent. An essential dimension might thus be entirely omitted. To avoid this risk, questionnaires tend to become longer, which can reduce engagement and the quality of responses.
Noise from scaling effects and halo effect
Asking for an overall rating followed by multiple questions on various criteria often leads to a halo effect: a respondent who gives a high overall rating tends to evaluate all dimensions positively, and vice versa.
This makes it difficult to pinpoint avenues for improvement for a highly appreciated product or to detect positive elements in a product that is generally rejected.
Limited comparability between different scales
If one sticks to the simplest method (correlations), it is difficult to directly compare dimensions measured on an agreement scale with those measured on a critical scale (where the ideal is the midpoint).
More advanced modeling methods (Bayesian networks, PLS regressions) can overcome this issue, but they are time-intensive and require significant expertise.
In the end, these traditional approaches may be incomplete, biased, and less effective for precisely identifying the drivers of overall appreciation.
The principles of the r3mscore emotional analysis
With R3MSCORE, we propose a radically different method to identify and rank appreciation drivers:
Spontaneous expression rather than a long list of criteria
Instead of presenting a battery of questions, we ask respondents to provide three words that spontaneously come to mind after testing the product.
This non-inductive approach covers a broad range of perceptions and prevents missing any relevant dimensions for some respondents.
Emotional weighting of words
An exclusive emotional analysis model assigns each word a weight reflecting both its emotional intensity and its valence (positive or negative).
This algorithm accounts for various criteria: grammatical nature, enunciative stance, consensus or divergence among respondents, etc.
Semantic analysis and thematic grouping
The spontaneous words are grouped according to their meaning. For example, “fresh,” “refreshing,” “freshness,” “very fresh,” and “refreshing beverage” are clustered under “fresh/refreshing.”
In practice, from the pool of words collected (3 per respondent), we obtain about 30 to 40 word groups. Each group is given an emotional activation score, which is the sum of all weights assigned to the words in that group.
R3MSCORE: an emotional KPI
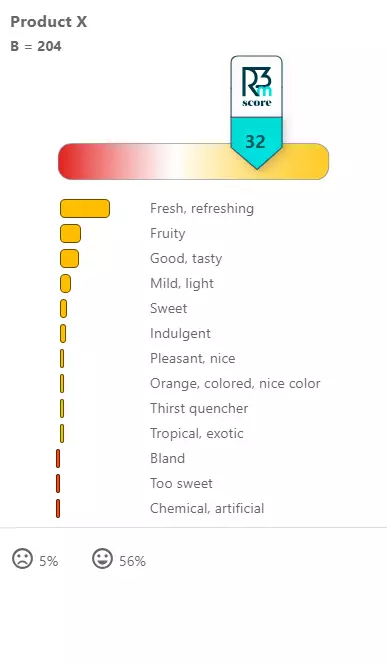
The global R3MSCORE indicator reflects the total emotional activation (both positive and negative) generated by the product experience. We then visualize each word group’s contribution to that overall score.
For instance, if the product elicits strong positive emotional activation (higher than the performance benchmark of 30), the dominant perceptions (e.g., freshness, fruity taste, lightness, etc.) stand out as key positive drivers, while any negative connotations (chemical taste, too sweet, etc.) also become evident.
A new approach to drivers of liking through emotional analysis
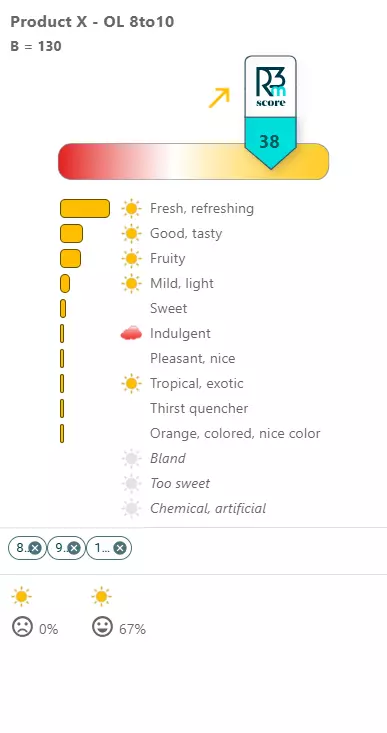
By comparing the R3MSCORE findings with the global appreciation rating, we can clearly identify the drivers of liking. Practically, we compare the R3MSCORE map of people who gave a low global rating (e.g., 1 to 6 out of 10) with that of people who gave an excellent rating (e.g., 8 to 10).
Examining the differences between these two maps quickly reveals a hierarchy of factors that influence the overall rating. In the example below, there is a clear alignment between the emotional activation measured by R3MSCORE (based on the three spontaneous words) and the stated appreciation: the R3MSCORE is 11 among those who gave a rating of 1 to 6, versus 38 among those who rated the product 8 to 10.
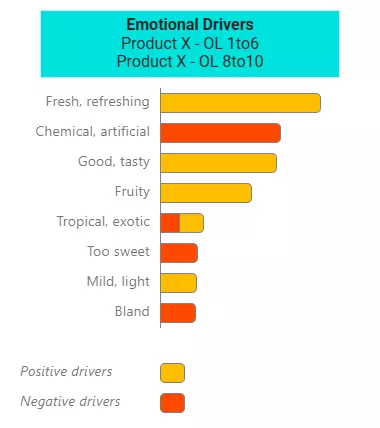
By comparing the two maps (see the figure on the right), we see the main drivers to prioritize in order to improve the product’s overall appreciation: freshness (a positive driver), any chemical or artificial impression (a negative driver), taste intensity, and fruitiness.

Comparison with traditional drivers analyses
Compared with common methods, the R3MSCORE approach is “purer” because:
- No induction: Dimensions aren’t imposed; they emerge freely from spontaneous words.
- No bias from scales or halo effect: We do not present a battery of follow-up questions after the global rating.
- Exceptionally rich analysis from only two questions:
- The three spontaneous words.
- The global appreciation rating.
In the end, with only these two questions (three spontaneous words and the global rating), we obtain a highly detailed analysis. We gather both an emotional KPI (R3MSCORE) and a declarative KPI (the appreciation rating), plus a hierarchy of the levers that influence both indicators.
This method proves particularly effective when respondents evaluate a series of sequential stimuli: thanks to a very concise questionnaire, we minimize fatigue and potential biases while preserving the spontaneity and relevance of responses for each product.


0 Comments